Why lithium? Great question. In my opinion, it’s simultaneously the simplest and most complex metal. Lithium’s ‘simplicity’ comes from the fact that it’s been used in industry for quite some time, and most of the general public know the metal in its battery form. Its complexity relates to the science behind how and why it’s presently used, but more importantly, the role lithium will play in the future.
Lithium isn’t rare, but the lithium market is definitely under developed in comparison to most other industrial commodities, leaving the space to a select few conglomerate giants and a group of junior companies. The fact is, lithium has a ton of applications, from lubricating grease and glass fabrication, to glazes for ceramics, and finally, batteries. In particular, lithium is and will continue to play an increasingly important role in the battery-powered clean air future.
Let’s take a closer look at the lithium narrative…
Lithium – Hard-Rock and Brine
Lithium is present in a number of different minerals, but for those who deal with its commercial extraction, there are really only a few that are of interest.
Pegmatites
Pegmatites are commonly found throughout the world, but lithium-rich granite pegmatites are much less common, making up less than 1%. Granite pegmatite-ore bodies are the hard-rock source of lithium. The lithium minerals that occur in granite pegmatites are spodumene, apatite, lepidolite, tourmaline and amblygonite.
Spodumene is the most commonly occurring lithium hard-rock mineral, which, once upon a time, made it the number one source of lithium metal in the world. It has since been surpassed by brines, which, for a number of reasons, have become the largest contributor to lithium production.
Pegmatite Hard-Rock Processing
Lithium hard-rock recovery can be broken down into a few key steps: crushing of the ore, concentration by froth floatation, followed by hydrometallurgy and precipitation from an aqueous solution. From here, depending on the application, the producer will typically create either lithium hydroxide or lithium carbonate, which can be sent to factories to be manufactured into its final form.
When evaluating a hard-rock lithium deposit, there are a few key things to look for:
Lithium Grade – Arguably the most important figure in any type of deposit. Typically, the higher the grade of lithium, the more economic the deposit.
By-Products – Not to be confused with ‘harmful’ impurities, by-products can help reduce the cost per ton because they have value. For lithium hard-rock deposits, tantalum, beryllium and caesium are examples of profitable by-products of the refinement process.
Impurity Levels – High concentrations of impurities (non-profitable by-products) can lead to higher refinement costs and could limit their use in end use applications, such as glass and ceramics.
Location – Poor proximity to infrastructure can make a high grade lithium mine a lot less profitable or not even economically feasible.
Brines
Lithium brine deposits are accumulations of saline groundwater that are enriched in dissolved lithium. Lithium concentrations are typically measured in parts per million (ppm), milligrams per litre (mg/L) and weight percentage.
Brine is pumped up from the ground and placed into man-made ponds, where the lithium is concentrated via evaporation. Depending on the climate and weather in the region of the brine deposit, lithium concentration can take a few months to a year. Typically, lithium concentrations range between 1 and 2%. Unlike their hard-rock cousins, these concentrations can be sent to processing plants for end use production.
All lithium brine deposits have a few common characteristics (Bradley, Munk, Jochens, Hynek, Labay. USGS – A Preliminary Deposit Model for Lithium Brines, 4).
- Arid climates
- Closed basin containing a playa or salar
- Tectonically driven subsidence
- Associated igneous or geothermal activity
- Suitable lithium source-rocks
- One or more aquifers
- Sufficient time to concentrate a brine
Similarly to the list of common characteristics for brine deposits, there are a few things that are particularly important when evaluating a brine deposit:
Evaporation Rate – evaporation is dependent upon the climate in which the deposit is located. Hours of sunlight, humidity, wind levels and temperature all have an effect on the evaporation rate. A low evaporation rate could make the difference between an economic deposit and an uneconomic one.
Lithium Grade – Arguably the most important figure in any type of deposit. Typically, the higher the grade of lithium, the more economic the deposit.
By-Products – Not to be confused with ‘harmful’ impurities, by-products can help reduce the cost per ton because they have value. For lithium deposits, the primary by-product is potassium.
Location – Poor proximity to infrastructure can make a high grade lithium mine a lot less profitable or not even economically feasible.
Impurity Levels – The magnesium to lithium ratio and the sulphate to lithium ratio are very important figures to look at when examining a brine deposit, because separating these impurities from the lithium is one of the largest expenses in the brine refinement process. For both of these ratios, you’re looking for low figures.
Brines are today’s answer to lithium demand as they are more wide spread, typically larger in resource scale, and generally have lower production costs. Countries such as Chile, Argentina and China extract the majority of their lithium production from brine deposits.
The Lithium Supply Story
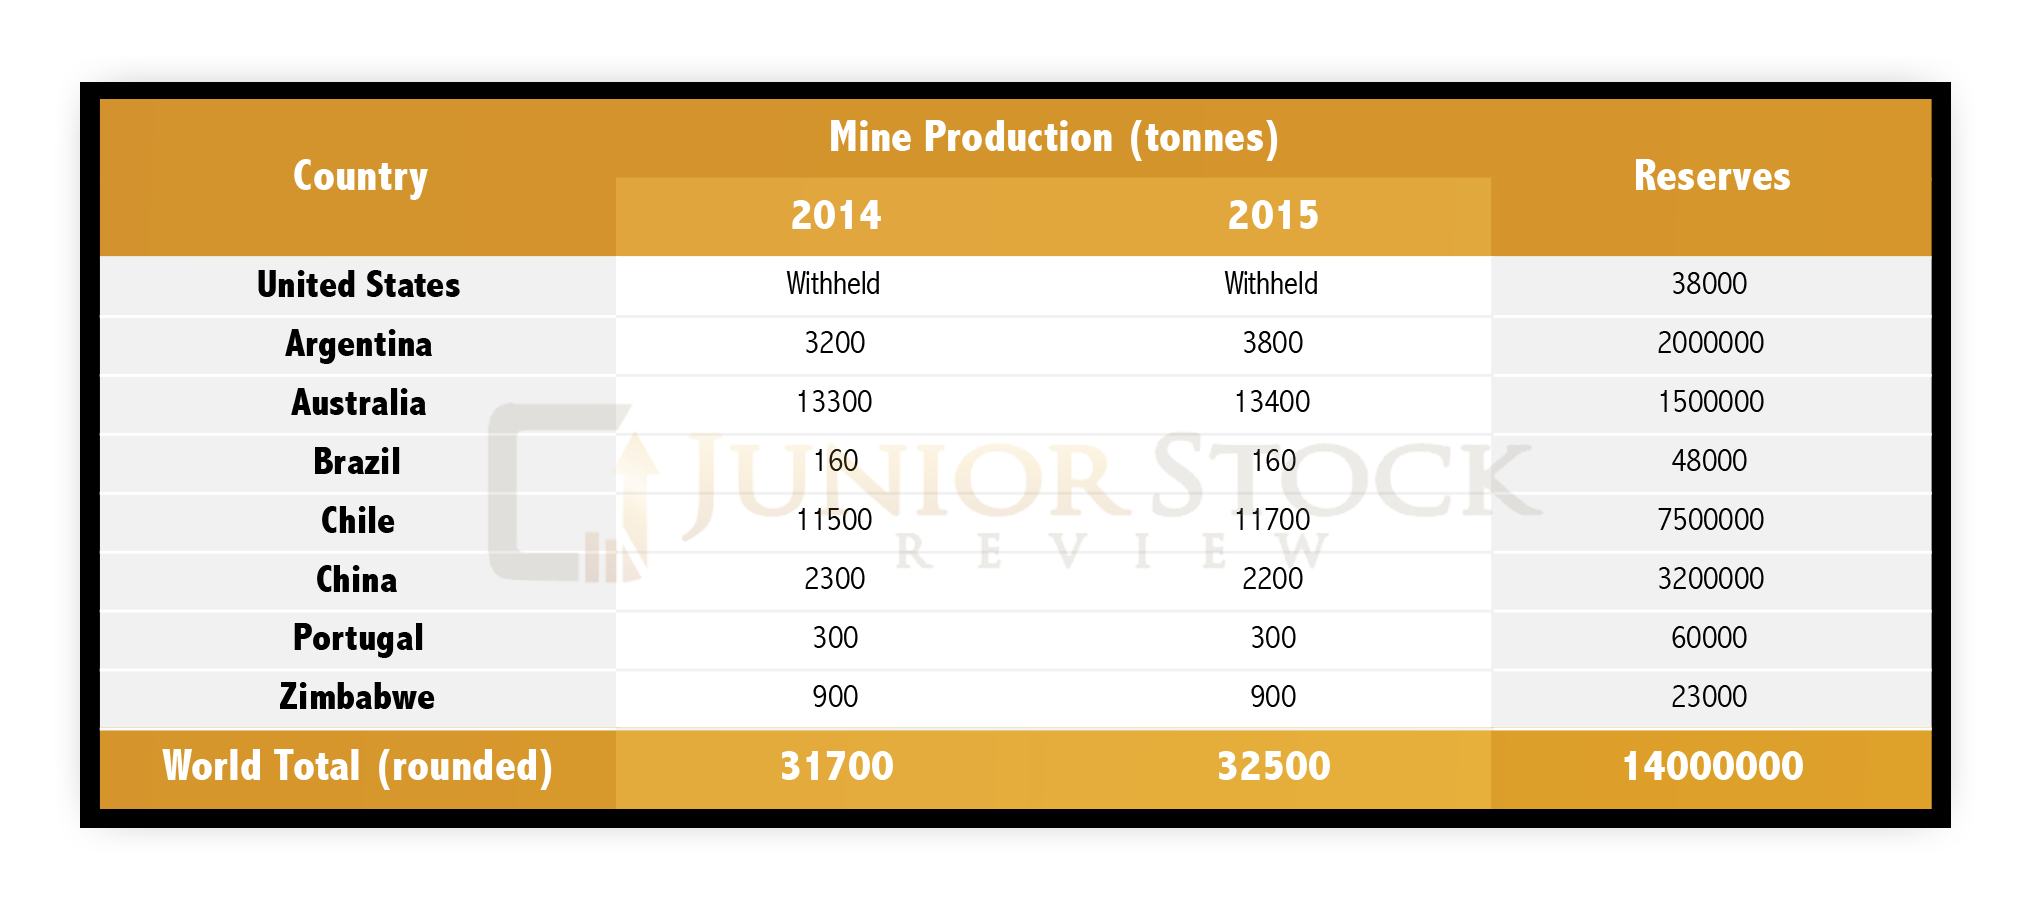
Source: United States Geological Survey (USGS)
Lithium reserves exist on 5 continents: North America, South America, Africa, Asia and Australia. As the table shows, however, there are reserves on 5 continents but the concentration is in South America, where there’s approximately 66% of the world’s reserves.
‘The Lithium Triangle’ refers to Chile, Argentina and Bolivia. Beginning with Chile, the number 2 producer of lithium in the world and 1st in reserves, their reserves are held in brine deposits. Its main brine deposit is The Salar de Atacama, which is located in the Antofagasta region. The Salar de Atacama is approximately 3000 square kilometres and has an estimated 6.8 Mt of lithium reserves.
For reference, ‘salar’ means a salt-encrusted depression (as in the nitrate fields in Chile) that may or may not be the basin of an evaporated lake
The other key player in The Lithium Triangle is Argentina, the number 3 producer of lithium in the world and 3rd in reserves. Argentina’s source of lithium, like Chile, is found in brines. Although Bolivia currently makes up the smallest portion of The Lithium Triangle, it’s thought to have the largest undeveloped lithium brine in the world, Salar de Uyuni. USGS Mineral Commodity Summaries estimates that this prized salt flat contains 9 million tonnes of identified lithium resource.
China is the number 4 producer of lithium in the world and 2nd in reserves. China’s lithium deposits are found both in hard-rock and brine sources. Its lithium-rich pegmatite deposits are found in Jiajika, Barkam, Altai, Koktokay and the Nanping district, while its lithium-rich brines, which possess the vast majority of its reserves, are found mainly on the Quighai-Tibet plateau.
Currently, Australia is the number 1 producer of lithium in the world. Australia’s lithium is held in hard-rock deposits, mainly the Greenbushes deposit, which is currently in production. Finally, the Mount Cattlin and Mount Marion projects, which aren’t yet in production, are expected to alleviate some of the supply crunch for world demand in the future.
Lithium is primarily sold through private contracts which are controlled by 4 companies:
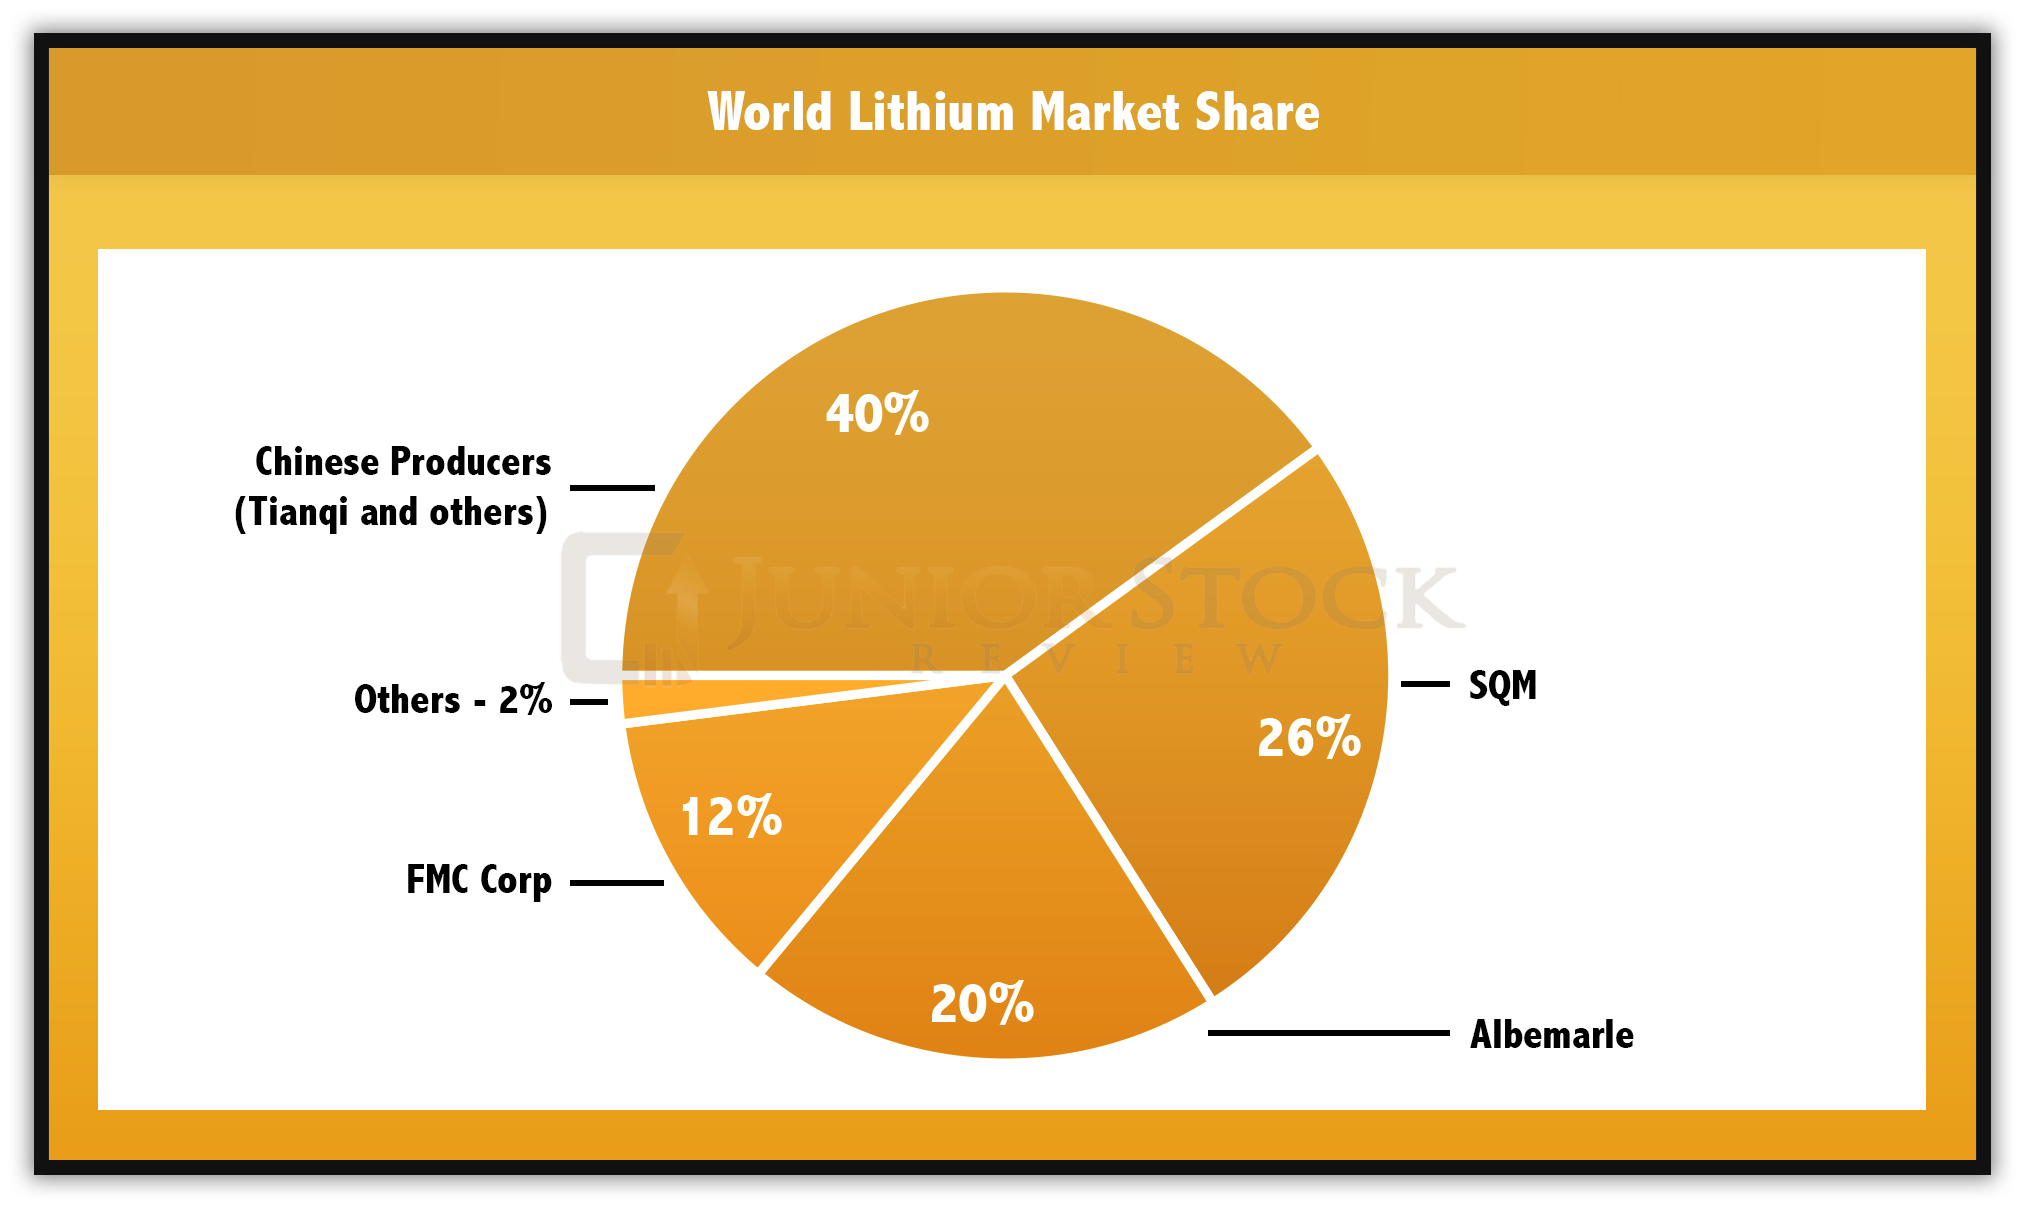
Source: Sociedad Quimca Y Minera De Chile – Corporate presentation – Slide 11
With only 4 major players in the lithium market, I have put together some quick points on each company to give you an idea of who they are, where they are, and what they do.
Sichuan Tianqi Lithium Industries – Tianqi information taken from their website, unless otherwise cited.
- Collectively, Chinese lithium producers have a market share of 40% (SQM – slide 11)
- Traded on the Shenzhen Exchange (SZSE)
- Based in China and founded in 1995. As stated on their website, “We…are a key enterprise to the Provincial Government’s initiative for the ‘Promotion and Support of Emerging Strategic Industries,’ ”
- Tianqi offers a diverse product line, with both specialty and industrial application lithium products.
Sociedad Quimca Y Minera De Chile (SQM) – All information acquired through corporate presentation
- Lithium market share of 26%
- Founded in 1968 to reorganize the Chilean nitrate industry. Over time, converted from a fully Chilean State owned company to a private enterprise by 1988.
- Ownership Structure: Pampa Group and Kona Group – 32%, Potash Corporation – 32%, Bank of New York (ADRS) – 23%, and Other – 13% .
- SQM is involved in a number of market segments, such as specialty plant nutrition, iodine, lithium, industrial chemicals, potassium and metals exploration.
- SQM lithium resources are held in salar brines within the Atacama Salt Desert region of Chile. Joint Venture Project in Argentina planned for production in 2019, with a 50K Mt/year capacity.
- Traded on the New York Stock Exchange (NYSE).
Albemarle – All Albemarle information taken from website and Corporate Investor Presentation (September 13, 2016)
- 2015 Lithium market share of 20%.
- Traded on the New York Stock Exchange (NYSE).
- Headquartered in Charlotte, North Carolina, United States.
- Albemarle Paper Manufacturing Company was founded in 1887.
- Albemarle is involved in a number of market segments, such as refining solutions, lithium and advanced materials, bromine specialties, fine chemistry services, and Chemetall surface treatment.
- In 2015, Albemarle acquired Rockwood Holdings, parent company for Rockwood Lithium, for USD $6.2 Billion.
- Albemarle operates the world’s 2nd largest brine project on Salar de Atacama in Chile, with an output of 25 ktpa, and the Silver Peak brine operation in the U.S., with an output of 6 ktpa.
- Australian Hard-Rock Resources – Greenbushes Mine (through Talison JV) – Albemarle’s share of annual capacity is 30 ktpa.
FMC Corporation – All FMC information taken from website.
- Lithium market share 12%.
- Traded on the New York Stock Exchange (NYSE).
- Established in 1883, FMC roots are in agriculture.
- Corporate Headquarters in Philadelphia, Pennsylvania and Charlotte, North Carolina.
- FMC is involved in a number of market segments, such as agriculture, health and nutrition and lithium.
- 79% of FMC’s lithium revenue is derived from the sale of lithium specialty products, such as lithium hydroxide, butyllithium, and high purity metal.
Technological Affects on Lithium Supply
A major impact to the lithium supply story could come from a technological breakthrough in the refinement of lithium brines. Current research and development dollars spent by South Korean giant, POSCO, and privately owned, Energi Corporation, are exploring methods of refining lithium brine without the use of evaporation. The current major cost in the brine refinement process is the removal of impurities such as magnesium, calcium, iron and potassium via evaporation and additives. If they are successful, it will revolutionize the lithium mining industry, as more deposits will become economical and existing mining operations could change production methods to capitalize on cheaper processing costs. When or if this occurs, is a big question.
That said, the fact that R&D dollars are being spent in lithium refinement is a major plus, in my books. With this much interest, I think you can almost guarantee a strong future for lithium, worldwide.
Lithium Demand
Currently, lithium’s demand is rooted in the following applications (in no particular order):
Lubricant Grease – An estimated 2.38 billion pound market, in which lithium-based greases make up 75%. Lithium-based greases generally have good stability, high temperature characteristics and water-resistance properties.
Glass – Lithium typically sourced from the mineral spodumene reduces the viscosity and thermal expansion of glass and, therefore, leads to increased melting efficiencies and/or larger effective furnace capacities. The end result is a substantial energy savings for the glass manufacturers.
Ceramics – Lithium is used in the ceramics industry to produce glazes. The glazes improve a ceramic piece’s shock absorption and stain resistance, protecting the piece against damage. Lithium carbonate is typically used for this application.
Health Products – Lithium, in small amounts (around 0.170 mg/L), is prescribed to those with bipolar disorders or individuals with depression who don’t respond to anti-depressants.
Batteries – Batteries are possibly the best known lithium application of all. It’s where the future lays for lithium demand. This will be explained further in the next section.
Batteries
Why is lithium used in batteries? Simply, with current technology, lithium provides the best combination of energy density (weight to power ratio) and price.
Batteries have essentially three main components: cathode, anode and electrolyte. When the cathode and anode are connected via a wire, for example, electrons flow from the anode through the wire to the cathode, creating an electrical current.
Currently, there are an estimated 80 different lithium-ion battery chemistries in production, with these varying chemistries all exhibiting different characteristics, such as capacity and voltage. Lithium is typically found in the cathode of the battery, commonly in the form of lithium cobalt oxide, while the electrolyte is commonly in the form of a lithium salt, such as LiPF6, LiBF4 or LiCLO4. The anode material is commonly carbon-based, with graphite being the most popular.
Overall, a lithium ion battery’s output is around 3.6 volts, which is more than twice as much as its alkaline cousin.
What does the current lithium demand by application look like?
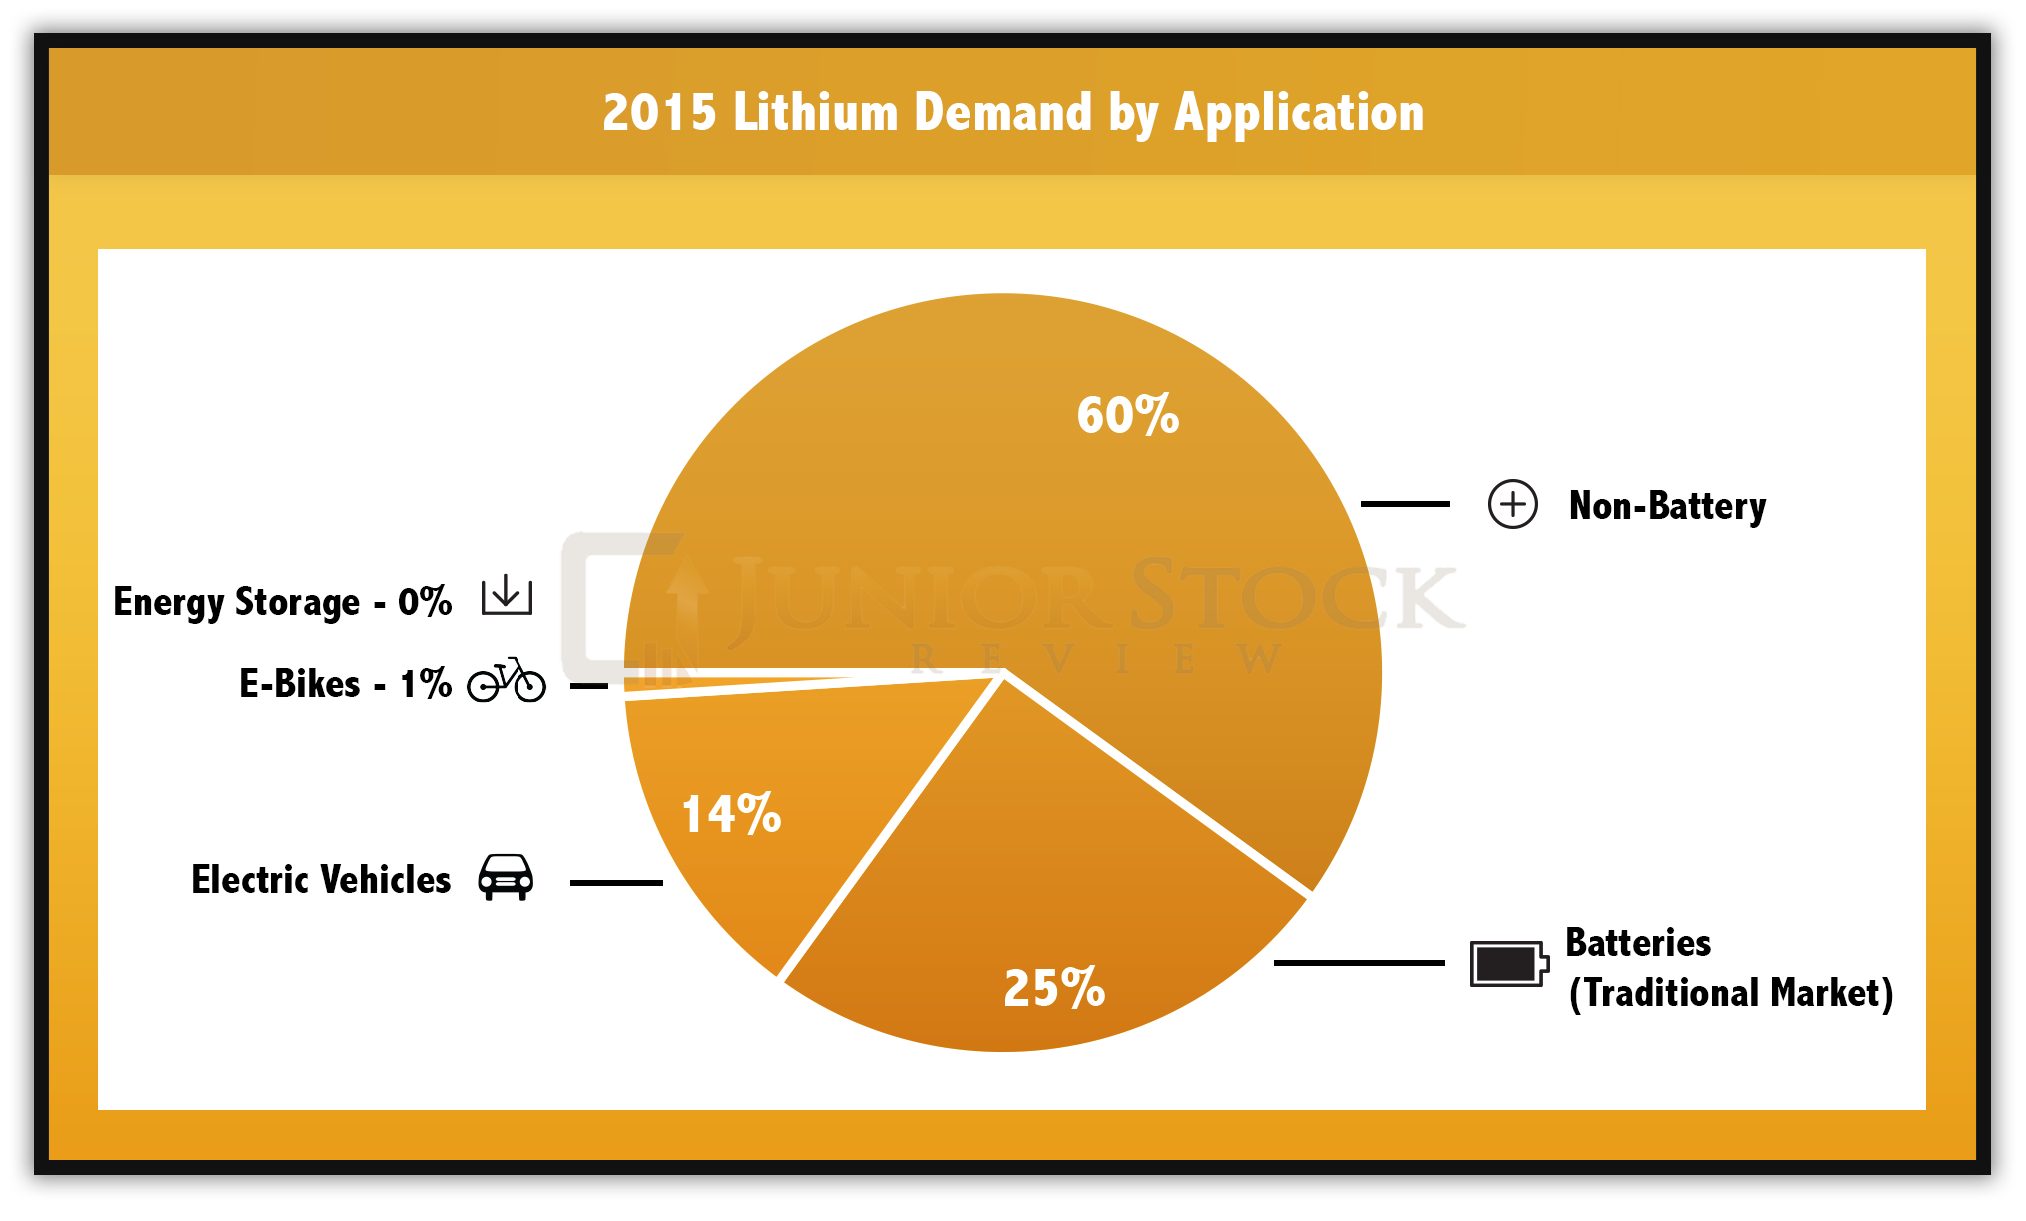
Source: Deutsche Bank Markets Research – Lithium 101 – pg.23
Projected demand for 2025 is much different, not only in overall demand tonnage, but the percentages each application encompasses. The future is expected to be bright for batteries in the non-traditional markets; electric cars, e-bikes, and energy storage.
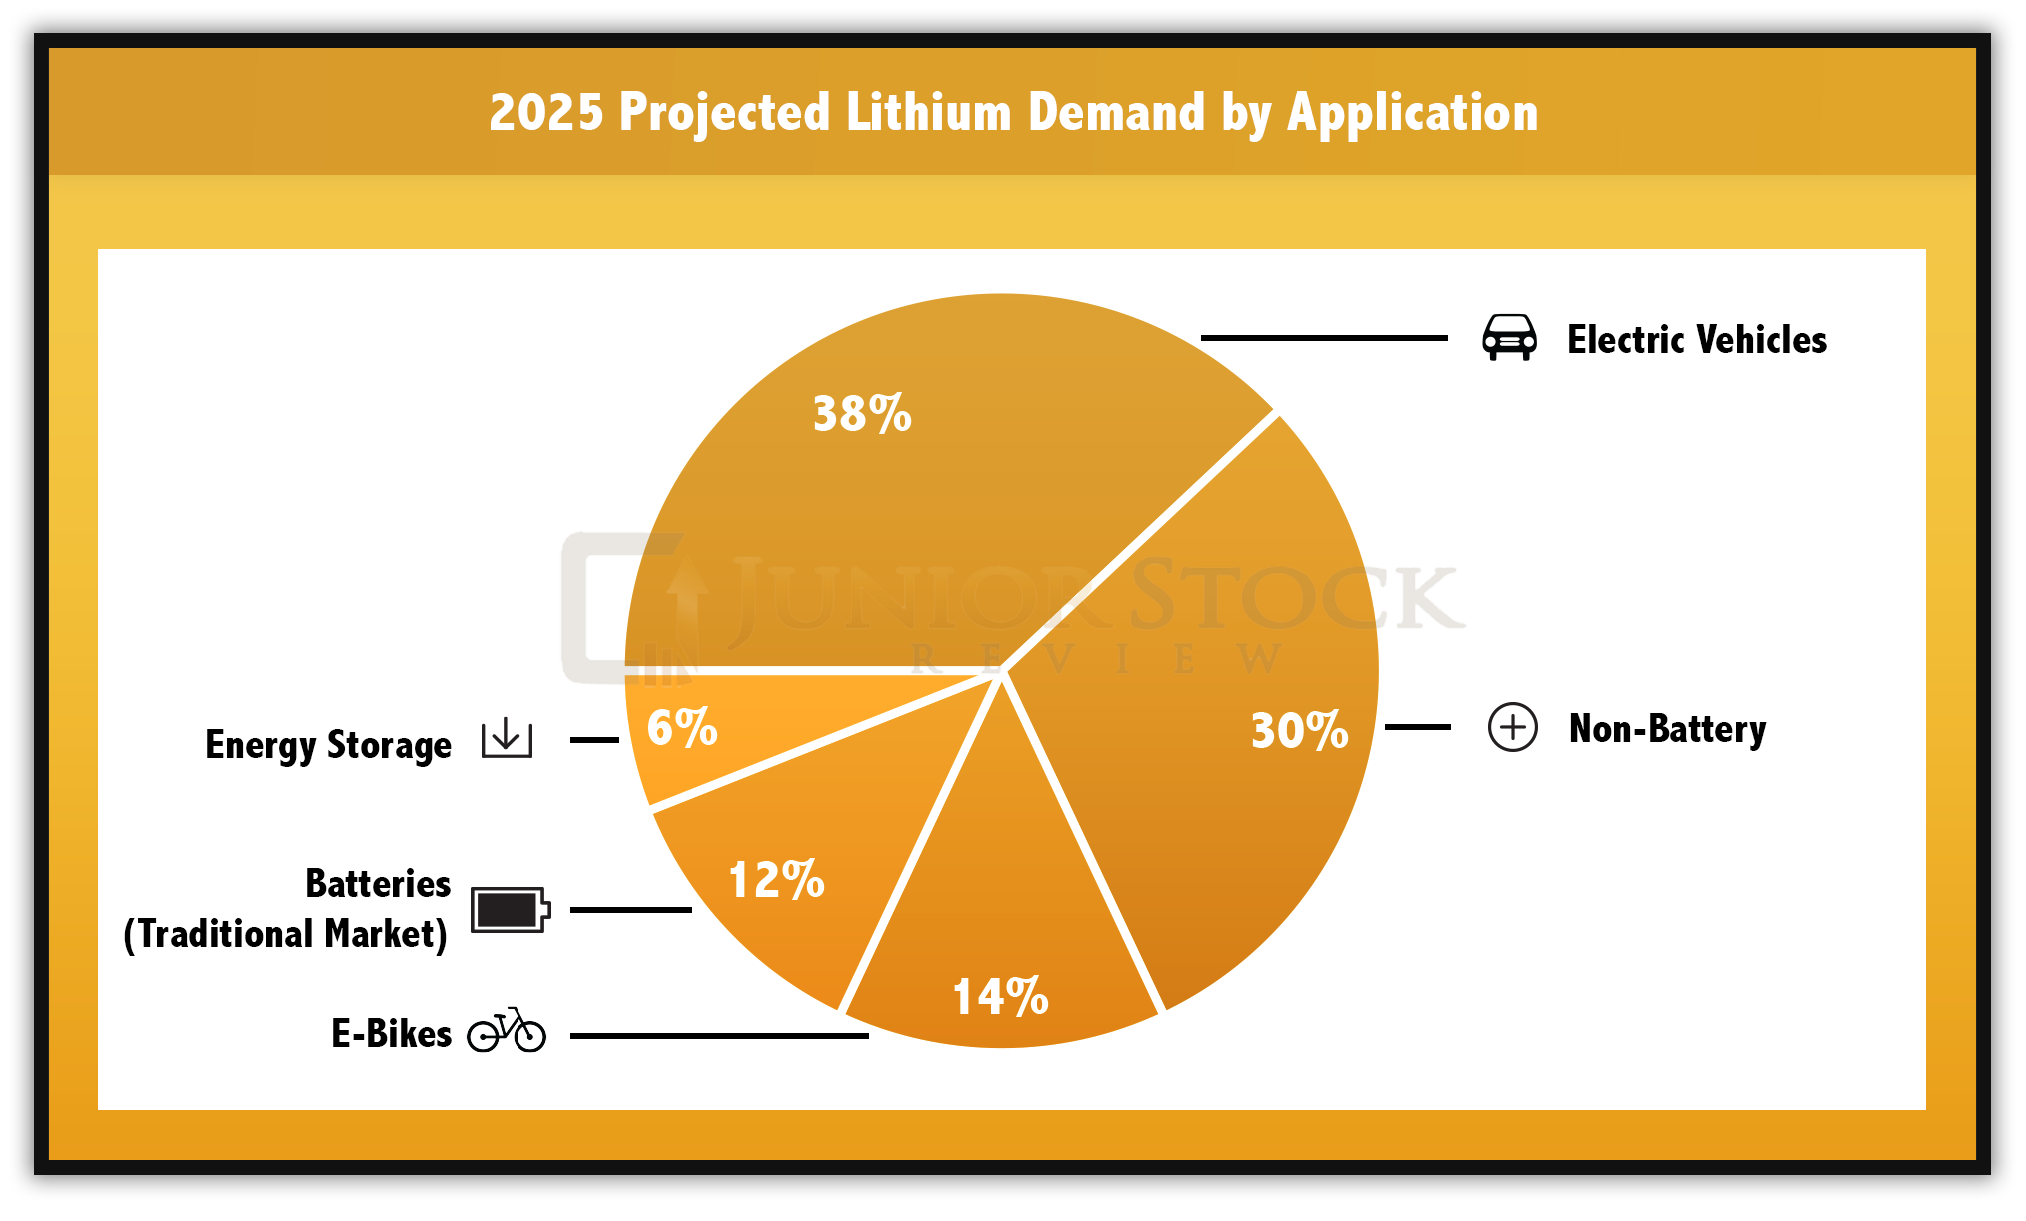
Source: Deutsche Bank Markets Research – Lithium 101 – pg.23
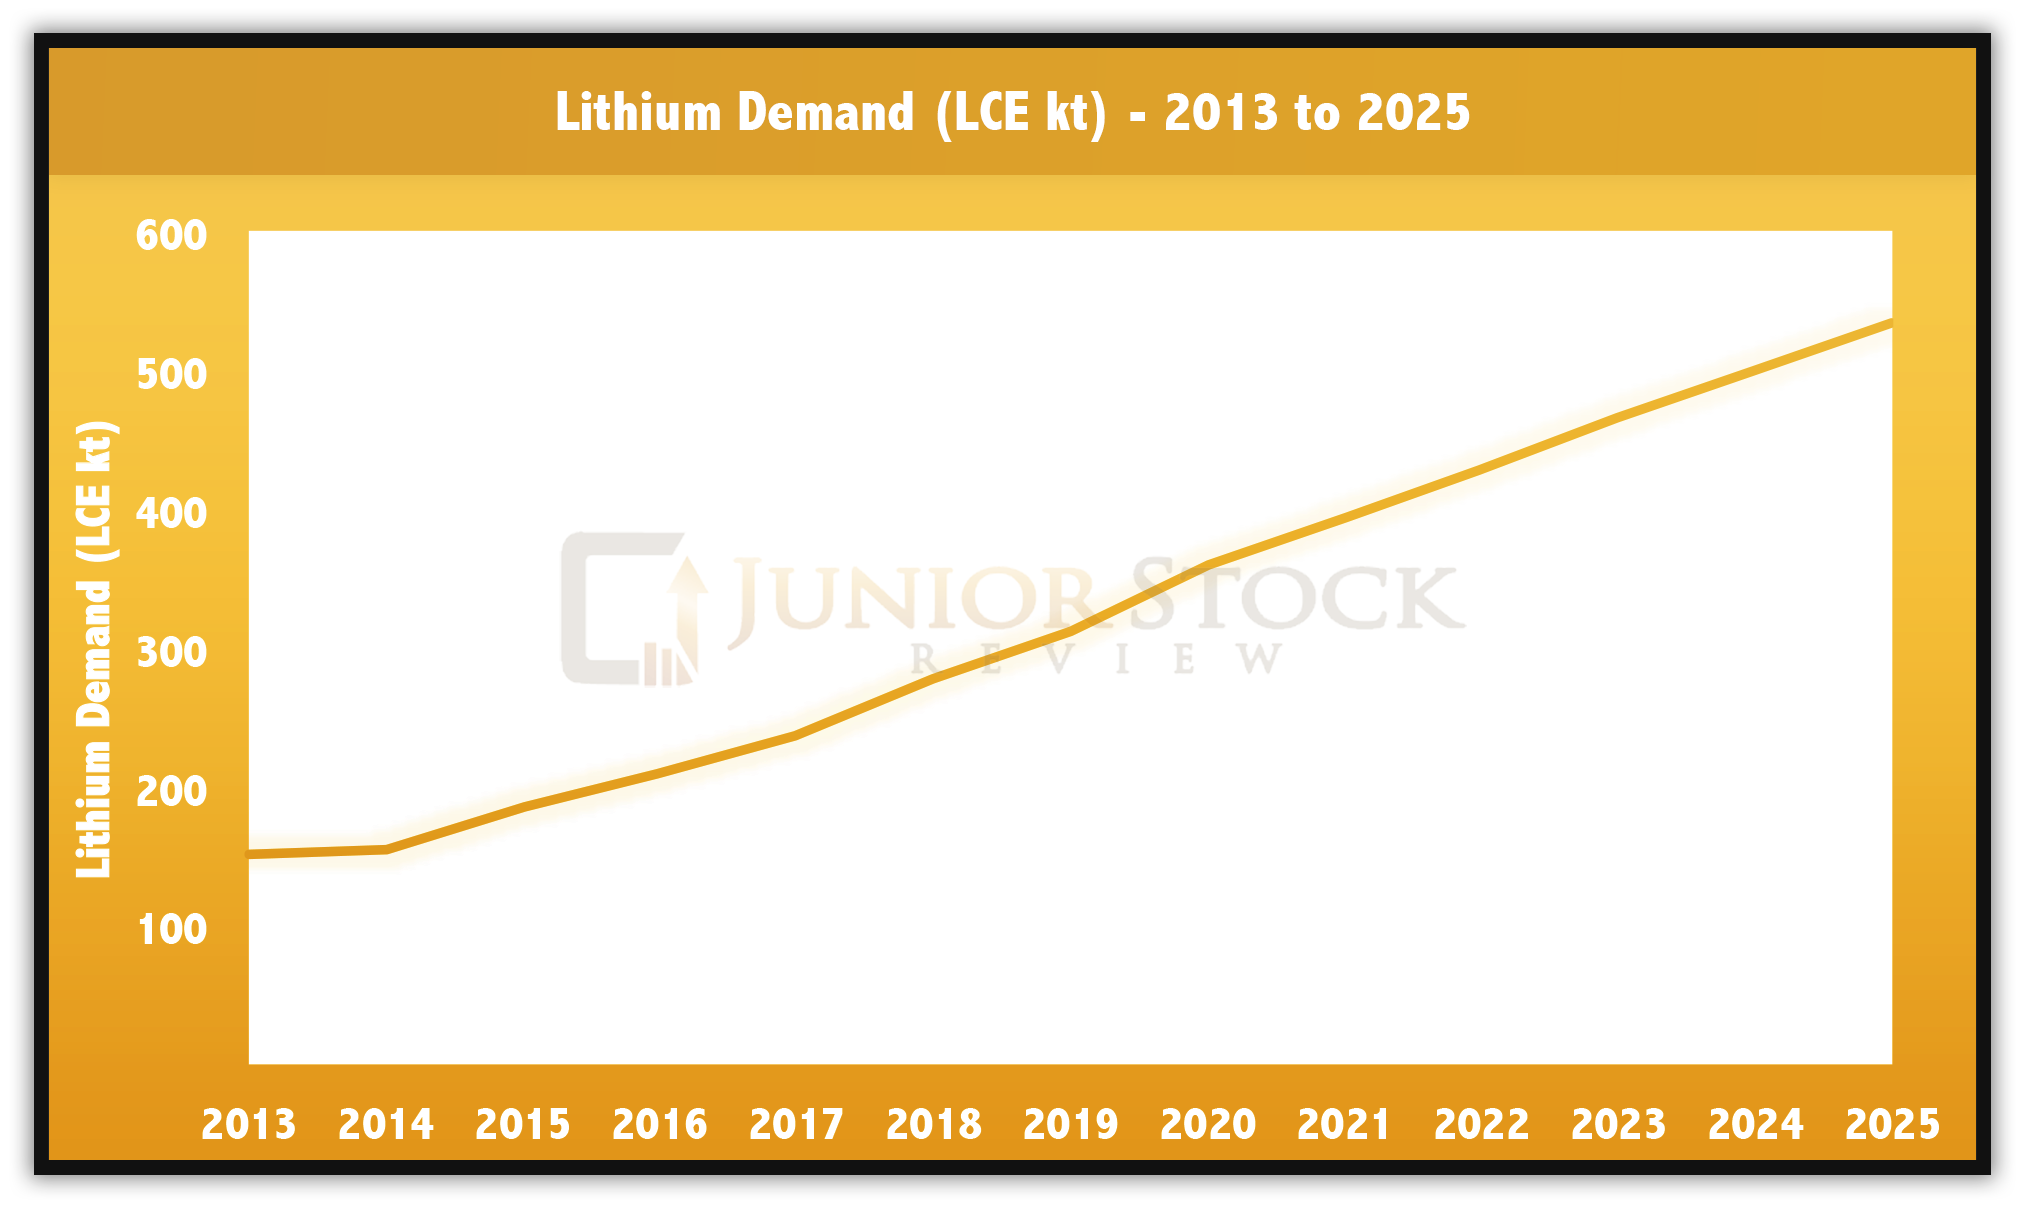
Lithium Present and Future Market Demand
Source: Deutsche Bank Markets Research – Lithium 101 – pg.23
The interesting thing about this projected demand curve is that it is linear. The reason I think that’s interesting is that most things in life don’t follow a linear path, especially those things that are rapidly changing, such as the lithium market. Now, the opposite could be true, the demand could be flat or declining in the future, but I tend to think that the future for lithium will be exponential.
For those who don’t know what an exponential function looks like, think of a hockey stick turned upwards with the blade in the air. Basically, it looks linear for a while, constant growth, and then boom – to the moon it goes.
Why do I think this? Mainly because of the politicized nature of green energy. Whether it’s the 450 Scenario or some other push to reduce carbon emissions, governments across the world are allocating more and more policy and CASH to the cause. The final inflection point could be massive and it could happen before 2025, in my opinion.
Emissions Perspective
The 450 Scenario calls for long-term concentrations of local greenhouse gases to be at 450 ppm CO2 equivalent by 2040. To put that into perspective, we globally emitted 32,381 Mt of CO2 in 2014 (International Energy Agency, 2016 Key World Energy Statistics, 45). Under the 450 Scenario, that number reduces dramatically to 18,777 Mt of CO2.
Using the United States as an example, Statista states that there were around 260 million registered vehicles in the United States in 2014. The U.S. Energy Information Administration (EIA) estimates that U.S. fossil fuel consumption for transportation in 2015 resulted in a combined 1,545 million tonnes of CO2, which is 29% of the total CO2 emissions by the country.
Emissions per vehicle = 1,545,000,000 / 260,000,000 = 6 tonnes/vehicle
Therefore, my estimated carbon emissions per U.S. vehicle is around 6 tonnes per year. If the United States figures to comply with the goals of the 450 Scenario, to drop transportation emissions to 26%, in-line with the rest of the world, they will need a reduction of 3% (29% to 26%) (International Energy Agency, 2016 Key World Energy Statistics, 46). The following calculation shows that a reduction of this magnitude would affect approximately 7.7 million vehicles.
3% of 1,545,000,000 = 46,350,000 tonnes of CO2
46,350,000t / 6 t/vehicle = 7,725,000 vehicles
NOTE: This calculation should not be taken as exact, there are assumptions that have been made. The calculation is only to gain some perspective on the potential impact of the 450 Scenario.
Insideevs.com reports that there were 116,099 full electric vehicles sold in the United States in 2015, and 441,179 worldwide. If you linearly distribute the number of vehicles affected by the 450 Scenario on a 23-year time horizon (2017 to 2040), 7,725,000 / 23 = 335,870 vehicles per year would need to be sold, or almost 3 times the number of current sales per year.
This is provided that car demand in the United States stays where it is. If there is growth in the number of people who want to drive, this electric vehicle number would need to increase.
How does this equate to lithium demand? Well, it isn’t an easy calculation as there are a lot of assumptions, but I did find an estimate of 47 lbs (0.021 t) of lithium per Tesla Model S (sedan). If 335,870 Tesla Model S were sold in the United States in a given year, this would translate into 335,870 x 0.021 t of 7,053 t of lithium, or 37,544 t of lithium carbonate (conversion from Li to LiCO3 – 1 : 5.323)
To summarize this example:
- Calculation only represents a 3% decrease in American transportation carbon emissions.
- A 3% improvement in emissions will affect the equivalent of 7.7 million vehicles.
- If these 7.7 million vehicles were replaced by fully electric vehicles over the next 23 years (450 scenario deadline is 2040), that would equate to 335,870 cars sold each year. In my opinion, it is highly unlikely that it will be linearly distributed.
- Using 2015 data from insideevs.com, world demand is roughly 4 times that of the United States, thus, if the world kept pace, it would equal around 1.3 million vehicles per year.
- In terms of lithium carbonate, 1.3 million electric vehicles could mean 150,176 t in worldwide demand.
I believe this 3% improvement scenario for vehicles per year is conservative. In reality, I think demand in the next 5 years could easily be twice as much. Deutsche Bank believes demand will hit 2.4 million in global electric vehicles sold in 2025. They estimate total demand in terms of lithium carbonate equivalent to be 534 kt, of which batteries would make up 45% (Deutsche Bank, Lithium 101 Report, 24).
The following table gives you a quick conversion factor for some common lithium compounds.
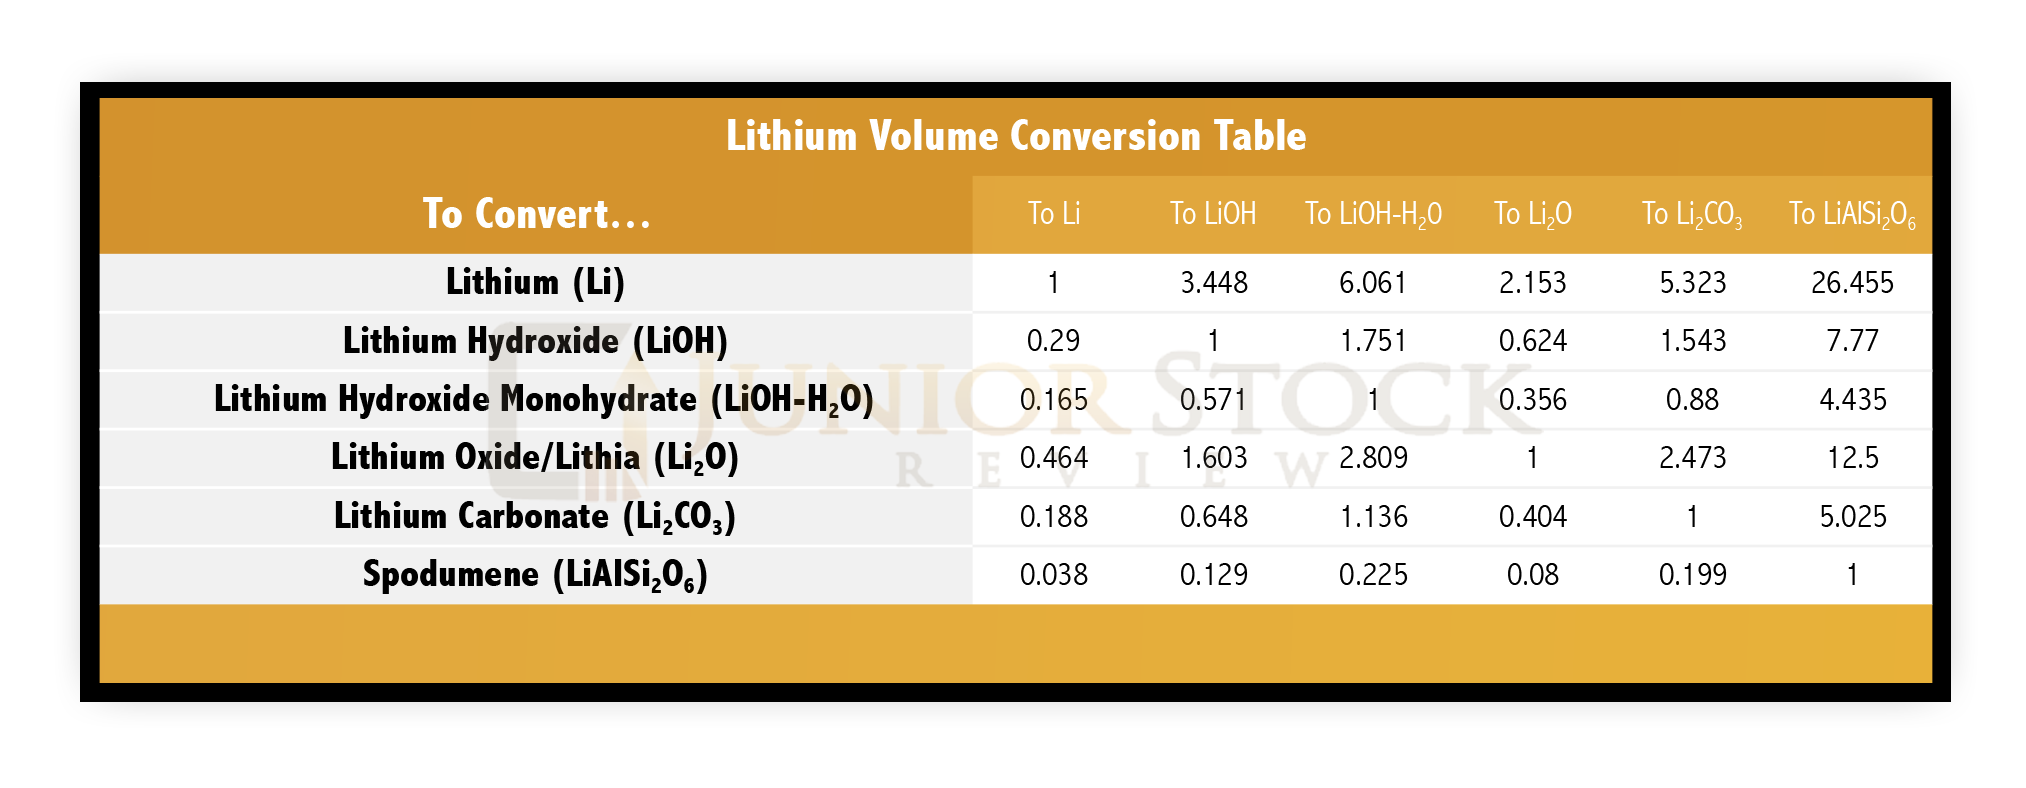
Source: London Stock Exchange
FYI – A quick example: If you’re given a resource in terms of %Spodumene, 5%, and you want to convert it to %Lithium, simply multiply the 5% by the lithium conversion factor 0.038, which equals 0.19%.
I believe it’s undeniable that lithium will play a major role in powering our clean air future. The trend is your friend and in this case it is only the beginning of what appears to be a major turning point in the way we live our day to day lives.
Until next time,
Brian
Disclaimer: This is not an investment recommendation, it is an investment idea. I am not an investment professional and do not know your specific investment criteria. Please do your own due diligence. I have not been paid to write this article, nor do I own any of the companies listed in this report.